The following is a collection of my completed Tidy Tuesday challenges.
From data wrangling to visualization. The journey has barely begun.
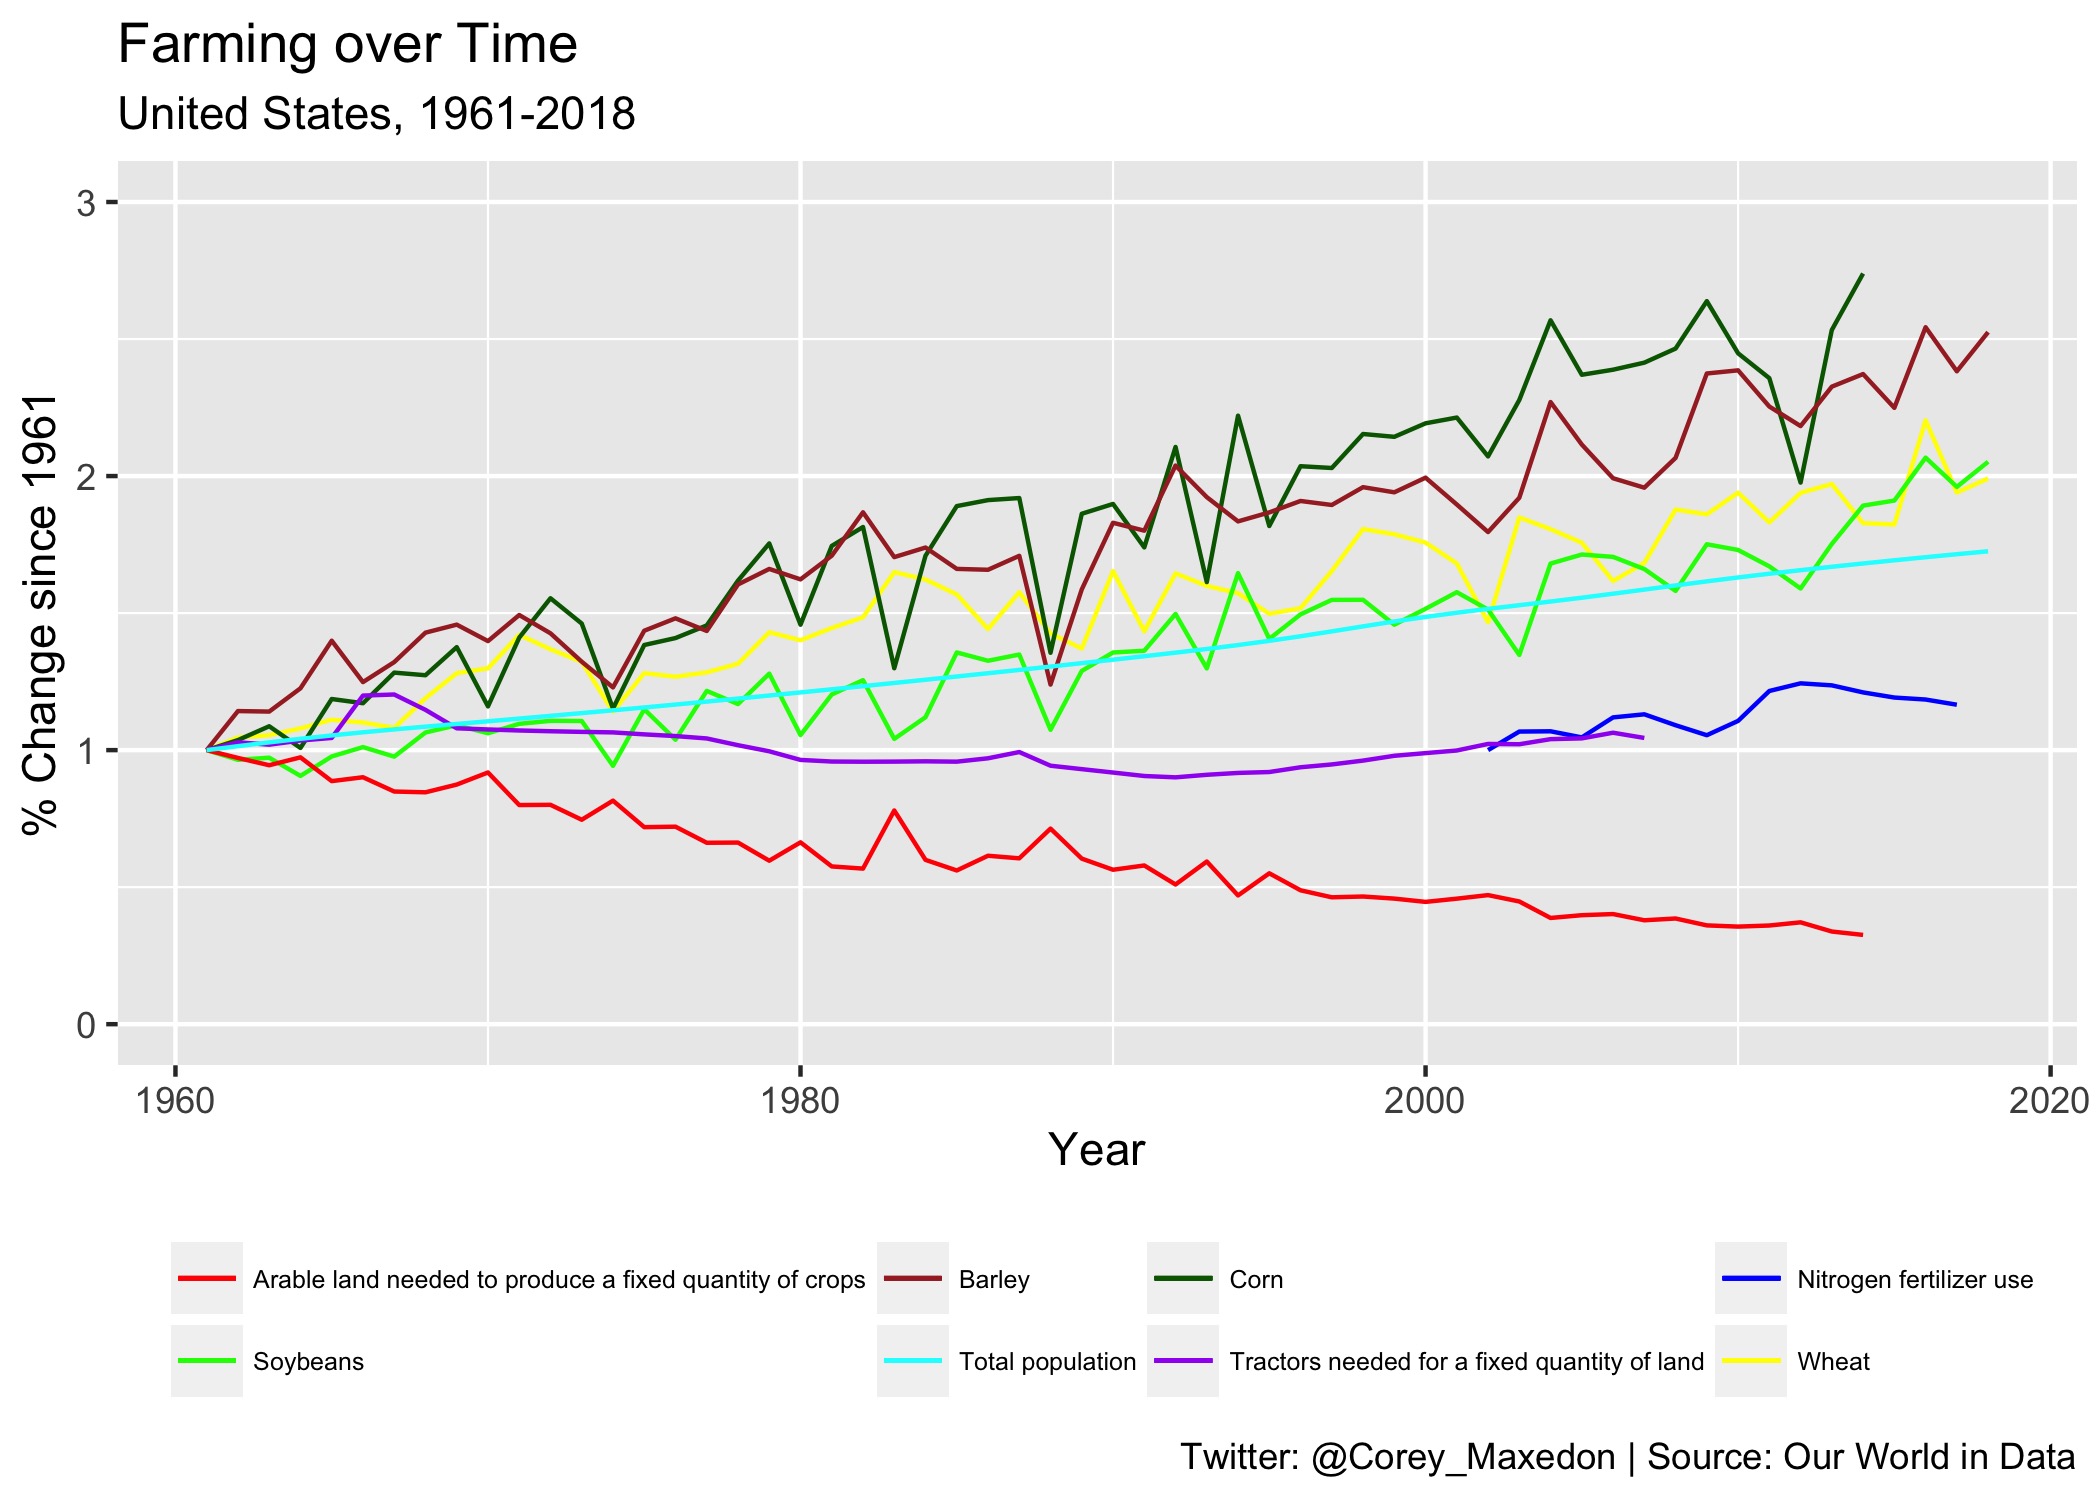
Crop Yields
Language: R
Using: tidyverse
This Tidy Tuesday data is about crop yields over the years. The data was retrieved from Our World in Data.
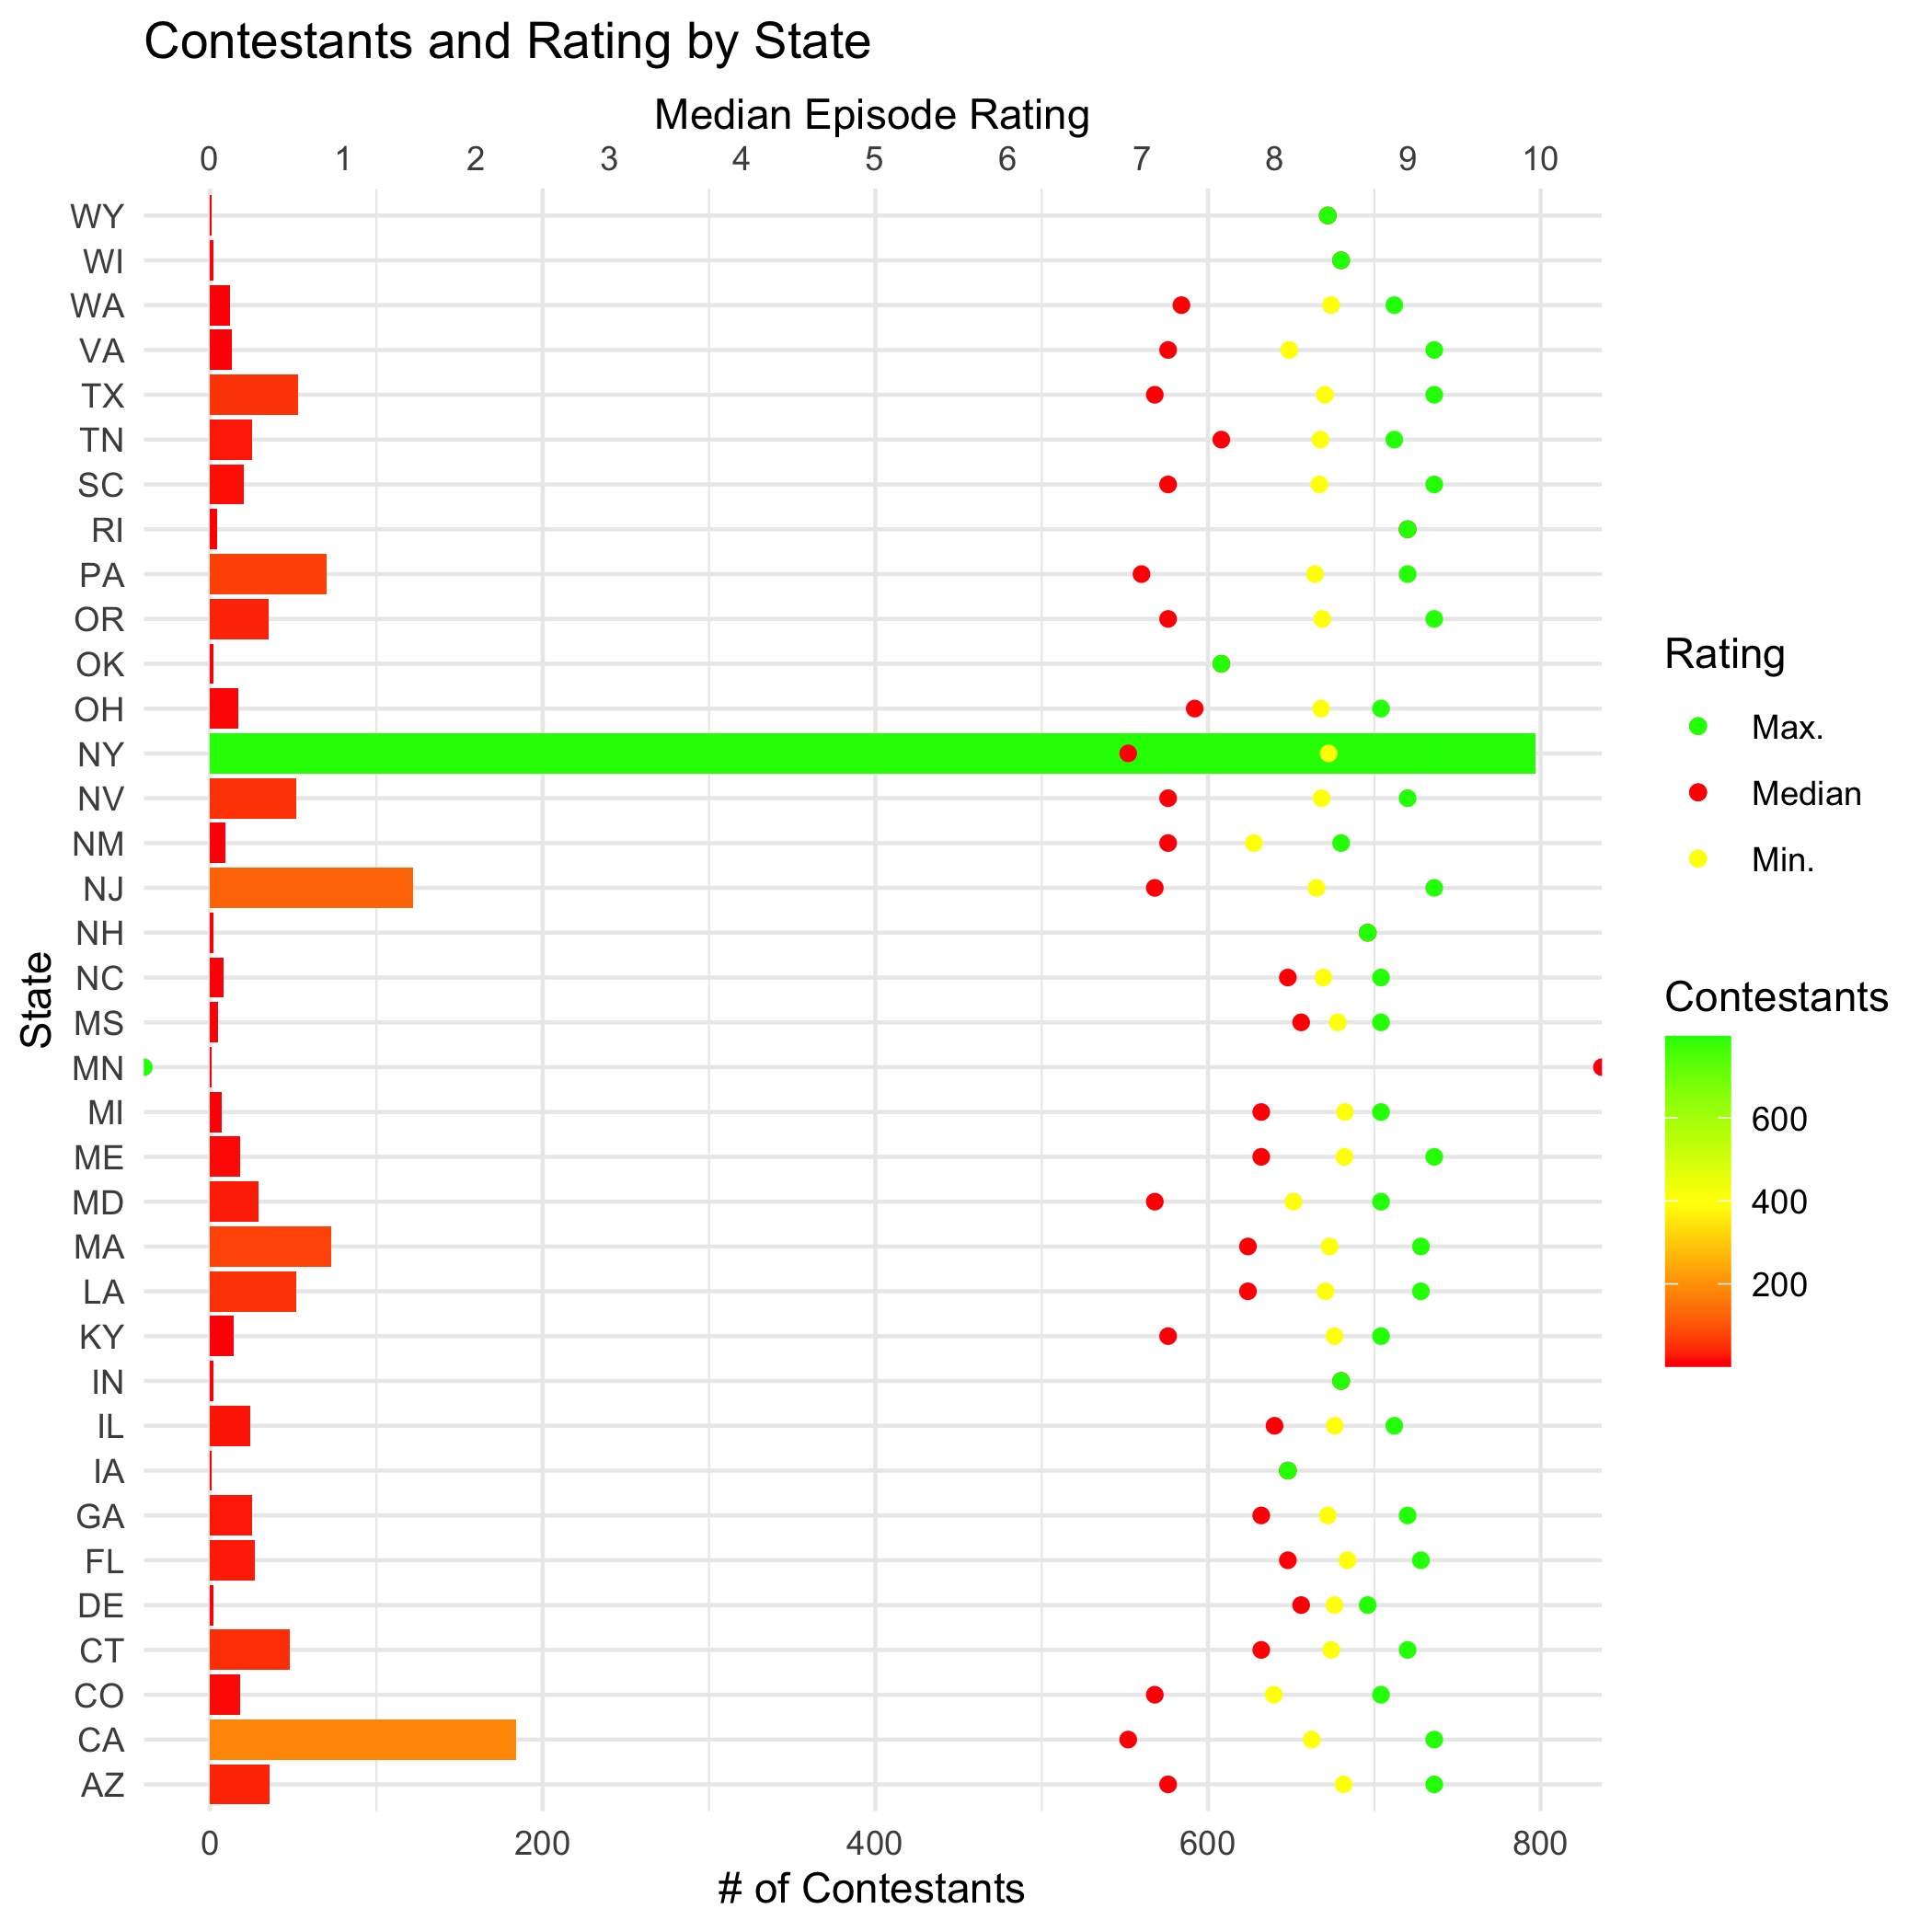
Chopped
Language: R
Using: tidyverse
This week’s data is about a show called Chopped. This is a cooking show where four chefs compete for $10,000 throughout 3 rounds. After each round, a chef gets “chopped.”
More to Come
New Tidy Tuesday projects added periodically. Check back soon!